If you're not doing your own chip design and fab, there's really no one else in town to buy from. AMD, Intel have fallen well short in GPUs. TPUs from Google/Amazon are a more likely threat long-term.
> Saturn's hexagon is a persisting hexagonal cloud pattern around the north pole of the planet Saturn, located at about 78°N.[1][2][3] The sides of the hexagon are about 14,500 km (9,000 mi) long,[4][5][6][7] which is more than the diameter of Earth[8] (about 12,700 km (7,900 mi).
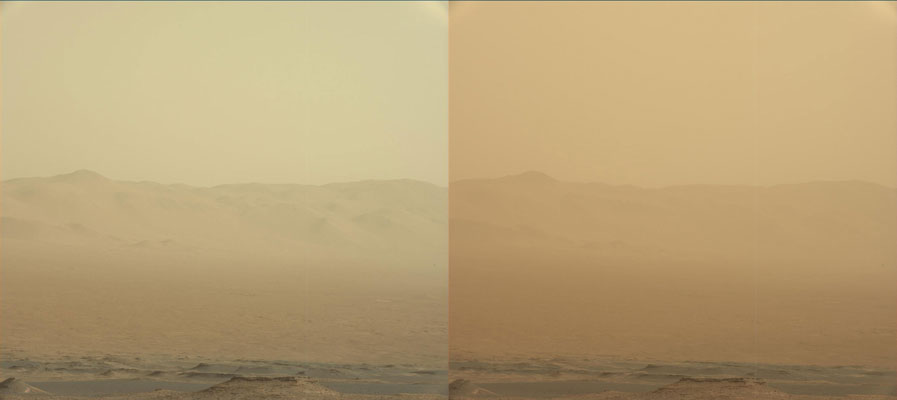
Why do the two photos at the top of that article look so weird? They look like 3D renders almost. Is that what it actually looks like to the eye too, if one looked at Saturn from a spacecraft orbiting around it?
They look like bad 3D renders because there are no walls and no sky in space, so all the light comes directly from the sun and shadows are absolutely black. The image looks different than with the naked eye though, because they filtered certain wavelengths. https://www.nasa.gov/jpl/cassini/pia18274
Shadows in space are often very high contrast, as there's no ambient light. Simple 3D renderers don't handle ambient light either, as simulating it can be very computationally expensive (instead of e.g. one light source, pretty much everything in the scene acts as a light source with the light it reflects). These images in particular are also in near-infrared, so they may look a little different to colour images of Saturn you've seen.
A near-perfect sphere? sure! Only looks-like-a-circle from some distant projection.
Vortices in a near-2d-flow like a river will absolutely be circular, vortices need to be coherent in some plane in order to sustain themselves.
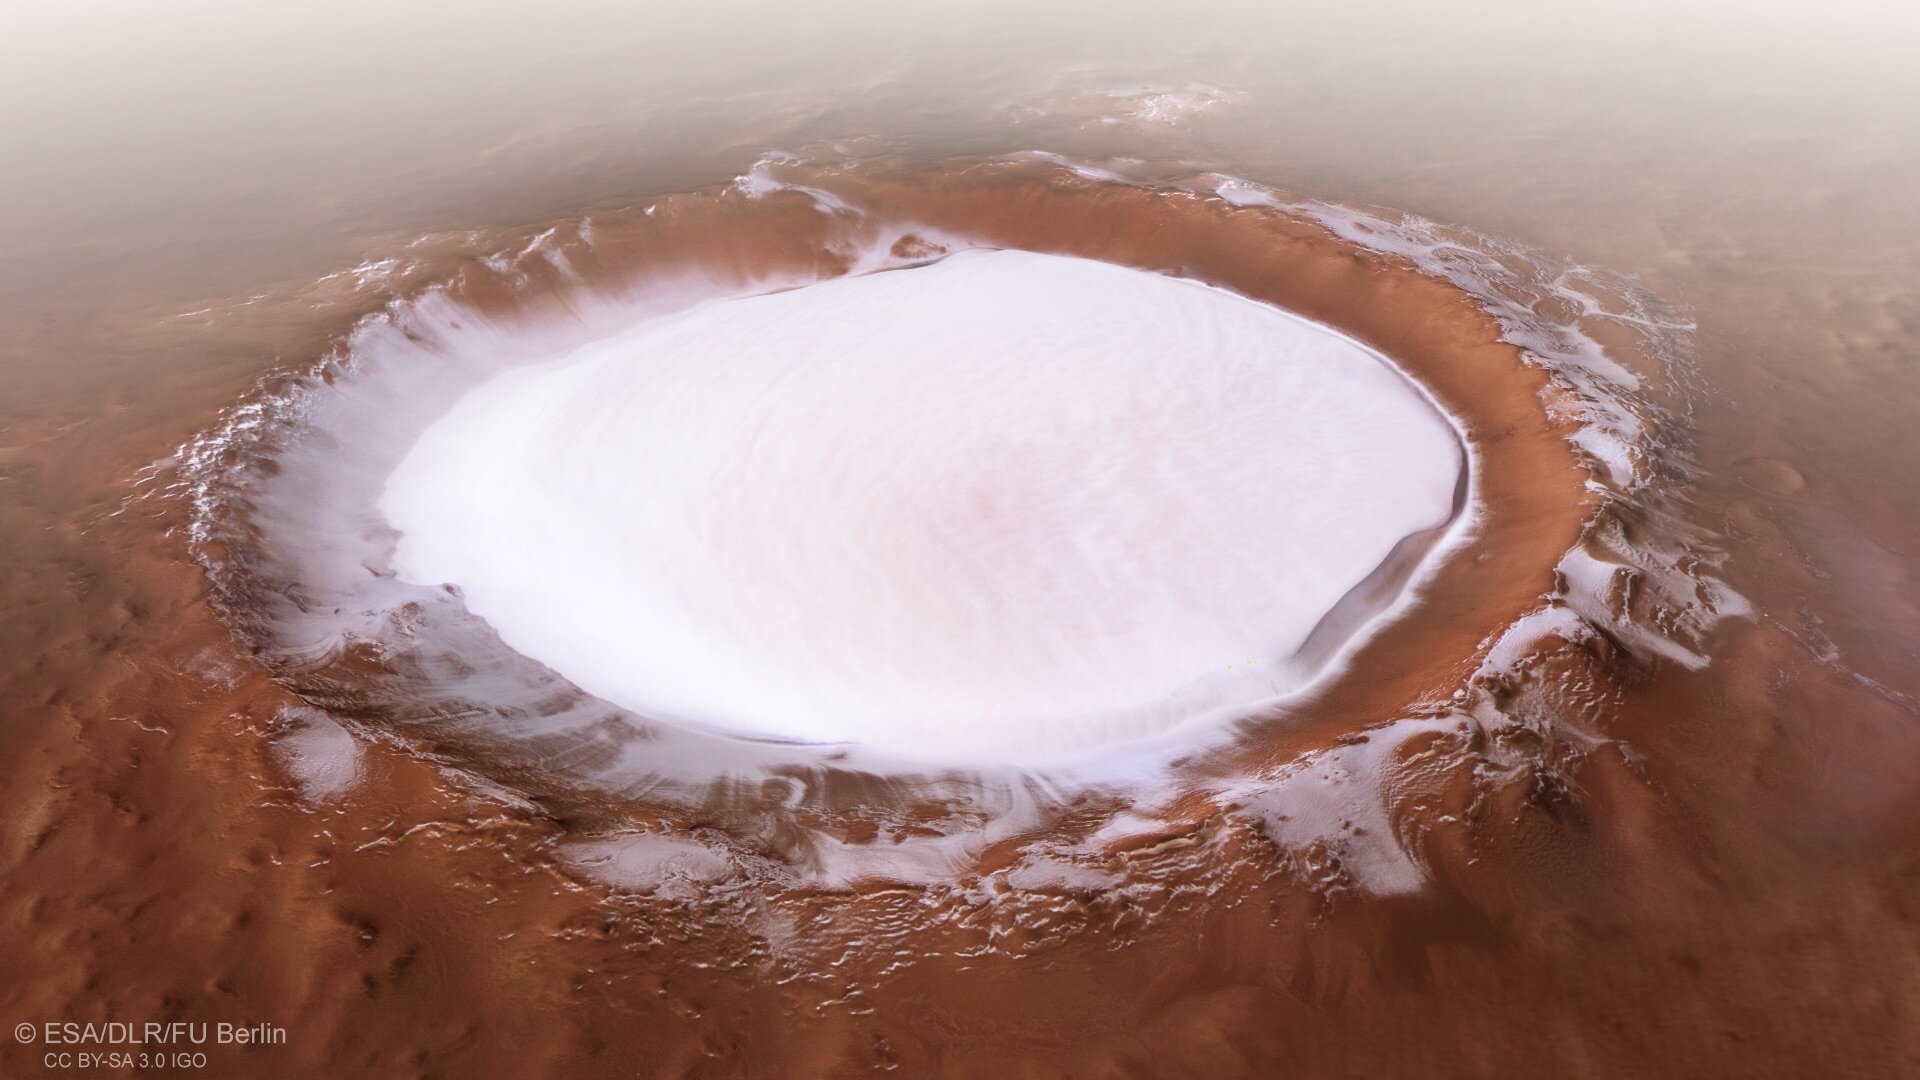
The specific circumstances here must be that that the water is on the edge of freezing during downstream flow and there is a naturally-very-long-lived vortex in one region for it to initially form the ice-disc. Must also be followed by some very-gently-bounceing-off-the-edges, and the river never getting too thin for it to get stuck.
Less lumpy than a billiard ball. The mountains and trenches only seem significant because the whole thing is so big. Totally not a perfect sphere though, yeah.
The myth is springs from the fact that if you had a smooth earth with a radius of center to Mariana Trench, and another smooth earth with a radius of center to Mt. Everest, you could shrink both of them by the same factor and fall within allowed billiard ball specifications. That says nothing about smoothness, only about the allowed size of ball.
If you actually shrunk the earth we're living on, the ball would still be rejected as quite too rough.
If you shrunk the earth down to the size of a billiard ball and the imperfections where only as rough as the bumps in medium sandpaper then that's still pretty darn round even if it wouldn't be acceptable under official billiard ball specifications. I never could get behind the idea that it would be smooth as a billiard ball but to know you could feel the ridges is pretty neat and yet it's very very round.
I think what you mean is "not that medium". You can find this sort of shape at the astronomic and the microscopic scales, just not usually at human scale.
"Your Honor, that sign on the entrance to the parking lot discussing parking restrictions and enforcement thereof somehow implied that they're giving me this device and authorization to use it how I see fit".
I suppose if someone leaves their wallet on the hood of your car while they're tying their shoelace, they've also authorized you to use their credit cards, right?
How do I apply a function to every element of a data frame where that function takes as input the i,j indices of the element along with its value?
This is a problem I struggled on for weeks in college. Eventually having to hack something together that relied on modifying the underlying data frame.
I've not return to R since as python has always had better libraries and easier to deploy.
In R you'd typically want to operate over vectors (rows or columns, with columns being the faster option) rather than on individual values. This requires a bit of a mental shift when you come to R from a C/Cuda background or even python.
You can find the man pages right in R console - look up `?lapply` for column-wise operations and `?apply` for row-wise.
In python, your MRI analysis library could be trivially hooked up with other cloud data pipelines. Companies would require fewer training courses on average.
python is the most popular programming language in the world and getting better.
They really don't. I've been at such an org as described by OP. I've owned a system of production R/Excel and it was migrated to cloud + python + ETL over 4 years.
The places where Excel are used are fairly appropriate. Way downstream, for simple tasks.
A lot of hard science is still done on the back of Excel, only begrudgingly adopting a data science mindset as the instruments produce more and more data. Data science is more than just streaming data, data lakes and machine learning.
Visual programming platforms like Knime is the next step for these teams, and then onto something like RStudio as they complete the transition towards employing data science in their pipelines.